Introducing Developer Dashboard: A Terminal-First Workspace for Local Developer Operations
2026-04-24
Most developers who spend serious time in terminals end up building the same accidental platform: shell aliases nobody remembers, one-off scripts buried in project folders, helper commands copied from old repos and a growing pile of local conventions that only make sense after months of muscle memory.
Developer Dashboard is an attempt to make that mess explicit, usable and maintainable.
It is not an editor replacement. It is not another shell. It is not trying to flatten your projects into one giant config directory. It is a shared operating surface for terminal-first developers who want their local tools, project context and repeatable workflows to stop fighting each other.
The Problem It Actually Solves
The audience for this tool is not beginners looking for a polished all-in-one IDE. It is developers who already have power tools, but whose local setup has become hard to reason about.
The friction usually looks like this:
- too many commands that only exist in shell history
- too many scripts with project-specific assumptions
- too many environment rules hidden in folder structure
- too much switching between terminal, browser, config files and background helpers
That kind of setup works right up until you need to reuse it, explain it or recover it on a fresh machine.
In one picture, the workflow shift looks like this:
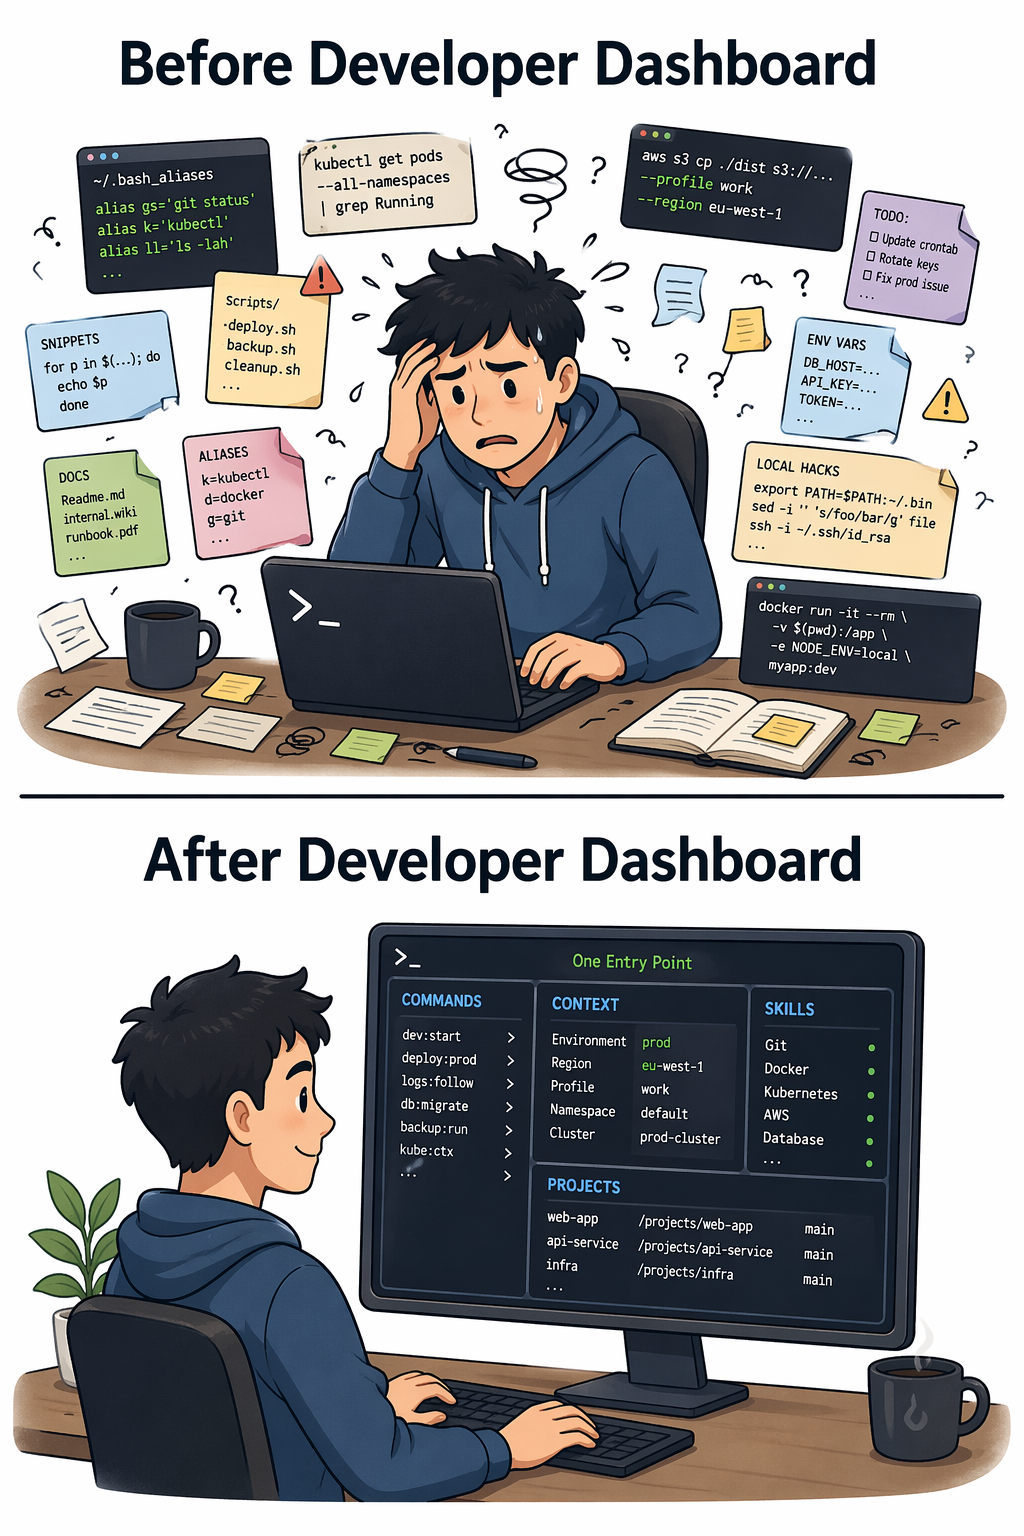
Developer Dashboard exists to reduce that overhead without taking the terminal out of the centre of the workflow.
One Entry Point Instead of Command Sprawl
The first useful idea is simple: one command surface.
dashboard version
dashboard init
dashboard skills install browser
dashboard restart
There is also a short alias:
d2That matters because command sprawl is not just ugly. It costs time. A stable entrypoint gives developers one namespace to remember while still allowing the system underneath to stay modular.
How to Install It
If you want to test the tool quickly on a clean machine, the shortest path is the install script:
curl https://raw.githubusercontent.com/manif3station/developer-dashboard/refs/heads/master/install.sh | shThat install path is aimed at the operating systems most terminal-first developers are likely to be running already: Debian, Ubuntu, Alpine and macOS.
This is the right kind of onboarding for a utility like this. A local developer tool should not require a long setup document before you can even decide whether it belongs in your workflow.
Why Layered Directories Matter
The design choice that makes Developer Dashboard interesting is the layered .developer-dashboard model.
Local development does not happen in one flat space. It happens across:
- a personal home environment
- one or more active projects
- nested folders inside those projects
- helper tools that should behave differently depending on where you are
Instead of forcing everything into a single global config, Developer Dashboard lets those layers stack. Home-level defaults can exist. Project-level behaviour can override them. Deeper folders can add more context when they need to.
That is a much better fit for real developer environments than pretending every machine has one clean root and one universal workflow.
Thin Entrypoint, Expandable System
Another good decision is that the public command stays thin.
The dashboard entrypoint acts more like a dispatcher than a giant monolith. Lightweight commands can stay fast, while heavier helpers only load when they are actually needed. That keeps the common path quick and makes the system easier to extend.
This is the right shape for local tooling. Developer infrastructure becomes painful when every tiny command drags the whole runtime behind it.
Skills, Pages and Runtime Helpers
Once the command surface is in place, Developer Dashboard grows through three practical ideas.
Skills
Skills are installable capability bundles. A skill can include commands, config, supporting files or automation for a specific job. That is a much cleaner model than manually copying scripts between repos until nobody knows which version is current.
Pages
Pages expose structured workflows instead of forcing every interaction through raw shell glue. That gives developers a way to build useful interfaces for recurring local tasks without abandoning terminal-first habits.
Runtime awareness
Some tooling needs more than files. It needs collectors, background helpers or a local web service. Developer Dashboard understands that part of the problem too, which makes it more than a folder organiser.
Where the Project Lives
If you want the source, the Git repository is here:
https://github.com/manif3station/developer-dashboard
If you want the Perl package documentation and release-facing reference page, the MetaCPAN entry is here:
https://metacpan.org/pod/Developer::Dashboard
Those two links matter for different reasons. The repository is what you read when you want the actual implementation and current project structure. MetaCPAN is what you read when you want the public module view, installation context and Perl-facing documentation surface.
Where This Is Useful
Developer Dashboard is most useful for developers who already know they need more structure, but do not want that structure to become heavyweight ceremony.
It fits especially well when you want to:
- keep project-aware helper commands close to the code
- expose repeatable workflows through stable local commands
- install and update reusable capabilities incrementally
- reduce shell-history archaeology
- turn personal scripting habits into something maintainable
That last part matters. A lot of senior developers eventually realise they have built a private internal platform by accident. The difference here is that the platform is acknowledged, layered and easier to evolve.
A Practical Starting Flow
The onboarding path is intentionally short:
dashboard version
dashboard init
d2 skills install browser
That sequence does three things quickly:
- confirms the command is installed
- initializes the local dashboard structure
- adds a useful capability without forcing a large upfront setup
That is the right tradeoff. The tool should become useful before it becomes ambitious.
Why I Think It Matters
There are already plenty of tools for managing code. Fewer tools take the messy middle layer of local developer operations seriously: the commands, scripts, context and runtime helpers that sit between your shell and your projects.
Developer Dashboard focuses on that exact layer.
If your current setup is a mix of aliases, copied snippets, sticky notes and memory, this project is aimed directly at that situation. It gives terminal-first developers a cleaner path from personal hacks to reusable local workflow infrastructure.
What Comes Next
This introduction stays high level on purpose. The interesting follow-up topics are more specific:
- how layered
.developer-dashboarddirectories resolve in practice - how skills are installed, upgraded and scoped
- how pages support developer-facing workflows
- how collectors and runtime helpers fit into the model
- how to bootstrap the setup on a clean machine without rebuilding it from memory
That is where the real value shows up.
If you want the practical follow-up on how the model actually works, read:
How Developer Dashboard Layers Context, Skills, Pages and Runtime
More Developer Dashboard Posts
If you want the rest of the series, continue here:
- How Developer Dashboard Layers Context, Skills, Pages and Runtime
- The browser Skill: Fast Playwright Checks Inside Developer Dashboard
- What Changed Since "Layers, Context, Skills, Pages and Runtime"
Closing
Developer Dashboard is not interesting because it adds another command. It is interesting because it gives developers a cleaner way to organise the tools they already keep rebuilding for themselves.
It keeps the terminal central, treats local context as a first-class concern and turns an ad-hoc pile of scripts into something much easier to operate over time.